A system is not a system unless it can be monitored and controlled...I recall something like that from a university course in Control Theory.
However, in a couple of blogs from now on I am going to give some ideas on how to monitor and control MySQL Cluster. To control, we need to have process management software that automatically restarts processes.
To do monitoring we need to have a tool to collect information... and here is a new monitoring tool, called CMON (instructions further down). CMON aggregates information from MySQL Cluster that earlier was only accessible from the cluster log or the management client, such as:
- cluster state
- node state
- backup statistics
- statistics
- cluster events (cluster log basically)
Here are some examples:
-- get memory usage
select nodeid,100*(pg_used_im/pg_tot_im) as im_used_percent from memory_usage order by nodeid;
select nodeid,100*(pg_used_dm/pg_tot_dm) as dm_used_percent from memory_usage order by nodeid;


-- get status of all data nodes
select * from node_state where node_type='NDBD';

-- backup status
select * from backup;

-- query the cluster log e.g,
select * from cluster_log where event="DISCONNECT";
Note: You must have MemReportFrequency=30 (or some other value) set in config.ini to get the Memory usage events!!
There is a README in the tarball that describes how to install it. If you want the long version, please read on.
Deployment (example HA environment)
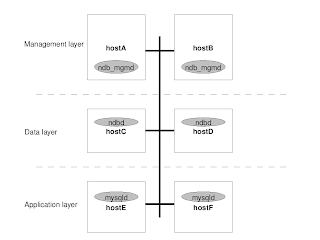
Here is a recommended setup that we will base the setup and installation CMON on. In an HA environment we typically have a setup like shown in the picture below:

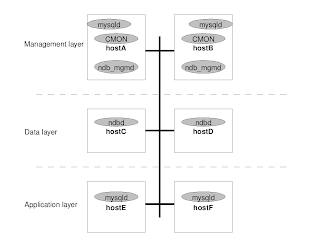
We have a number of processes that are deployed on its own hardware (hostA, hostB etc). Now, let's add CMON to this layer. I would add CMON to the Management Layer, and I would also add a mysqld on that layer so that CMON can log locally. The picture would then look like:

The MySQL server on hostA and hostB does not have to be connected to the Cluster but can be standalone. In later blogs we are going to add process management to this picture as well. As you can see we have a redundant pair of CMONs, and thanks to the SQL interface to cluster state information it is easy to write web applications to hook into this. So we are all good.
Moreover, a solution like the above picture can easily be generated using the config tool.
Installation
In order to install CMON on a computer corresponding to hostA or hostB in the picture above.
- Download the code
- tar xvfz cmon.tgz
- make sure you have mysql_config on the path!
- if you have used the config tool (and the default install path):
- export PATH=/usr/local/mysql/mysql/bin:$PATH
- cd cmon
- sh autogen.sh
- ./configure
- make
- make install
- export LD_LIBRARY_PATH=/usr/local/mysql/mysql/lib:/usr/local/mysql/mysql/lib/mysql
- cmon --help
- if you have a mysqld started on localhost
- mysql> source sql/cmon.sql
- cmon &
- this is equivalent to:
cmon --mysqluser='root' --mysqlpasswd='' \
--mysqlhost='localhost' --mysqlport=3306 \
--mysqlsocket='/tmp/mysql.sock' \
--ndb-connectstring='localhost' & - if you don't have the mysqld on localhost you might have to GRANT and use the options that you get from cmon --help to connect correctly to the mysql server.
- You can find more example queries in sql/queries.sql
And please let me know what is wrong with.. johan at severalnines dot com!
On the road map:
- make it as a real daemon
- add more data to the tables
- notifications
Because I have no idea how to do that.
Known issue: sometimes the cmon crashes on startup. The crash actually happens in libmysqlclient_r. However, it is just to start it again if this happens. I am looking into this.
Aug 13. 2008 - fixed bug in cmon.sql script.
Please note that all this is of MySQL Cluster 6.2 and MySQL Cluster 6.3.
Good luck!
6 comments:
Sort of shameless plug, but I wrote ndb_watch which mails out a sysadmin upon node failure (and now memory stats too).
You might be able to integrate some of the technology into your work.
Step 11 lists to run mysq> source sql/cmon.sql ...however, cmon.sql script is nowhere to be found.
Can you please provide a downloadable link to the cmon.sql script?
Hi,
The tables should be auto-created by cmon when it starts.
I am currently rewriting cmon and it will soon be released, and will incorporate better/working graphs.
BR
johan
Hi,
I have cmon installed for my clusters. Everything is working fine including cmon starting perfectly. But I am not able to see memory usage. I checked the cmon.memory_usage table, but it has no data. Any pointers , on why I am not able to get memory usage statistics in the table ?
Hi Umang,
Yes, you need to set
MemReportFrequency=30 (memory stats will be sent every 30s) in config.ini!
Restart ndb_mgmd(s), then the data nodes one by one and you should see the memory usage.
BR
johan
Hi Johan,
Thanks for your reply. that did helped.
Cheers,
Umang
Post a Comment